Pre-require understand
Introduction
The Kube-Prometheus-Stack is a great tool for monitoring your Kubernetes clusters, offering comprehensive visibility into your infrastructure. This blog post covers various aspects of using the Kube-Prometheus-Stack, from getting started with Helm to ensuring optimal configurations and security measures. We will also discuss Kubernetes exporters, using federation for multiple clusters, and developing custom Prometheus rules and Grafana dashboards.
What is the Kube-Prometheus-Stack solution?
The kube with Prometheus operator chart allows you to install the kube Prometheus project stack that allows monitoring your Kubernetes clusters effectively. It provides observability to various aspects of your K8s environment and Prometheus discovers podmonitors .
The Kube-Prometheus-Stack is part of the kube-prometheus project, which provides a set of Kubernetes manifests, Grafana dashboards, and Prometheus rules for monitoring Kubernetes clusters. Below, we are using the Kubeapps dashboard to install. You can also perform a helm rollback, delete, etc.
When installing the Kube-Prometheus-Stack, you must ensure the raw.githubusercontent.com domain is accessible from your Kubernetes cluster.
You can use Prometheus for alerting and Prometheus rules combined to deliver observability on metrics in your Kubernetes cluster.
Minimal recommended Prometheus version
Prometheus LTS refers to specific releases of Prometheus that receive bug fixes for an extended period, providing long-term support.
Every six weeks, a new cycle of minor Prometheus releases begins. After this period, minor releases generally no longer receive bug fixes. If a user encounters a bug in a minor release, they typically need to upgrade to the latest Prometheus release.
Upgrading Prometheus is typically straightforward due to the API stability guarantees in place. However, there is always a risk that new features and enhancements could lead to regressions, which may require another upgrade.
Prometheus LTS releases, on the other hand, receive bug, security, and documentation fixes for a period of one year. The build toolchain is also kept up-to-date. This allows companies that depend on Prometheus to limit the risks associated with upgrading while still being able to rely on a community-maintained Prometheus server.
What are typical Kube-Prometheus use cases?
Kube-Prometheus-Stack is typically used for:
- System performance monitoring: Gain insights into the performance of your Kubernetes cluster, including CPU and memory usage, network traffic, and disk space utilization.
- Alerting and incident management: Set up alerts based on specific thresholds and metrics to proactively detect and manage incidents in your cluster.
- Observability: Enhance your Kubernetes cluster’s health visibility, allowing you to make informed decisions and optimize your infrastructure.
Components
The kube-prometheus-stack Helm chart is the simplest way to bring up a complete Prometheus stack inside your Kubernetes cluster. It bundles several different components in one automated deployment:
- Prometheus – Prometheus is the time series database that scrapes, stores, and exposes the metrics from your Kubernetes environment and its applications.
- Node-Exporter – Prometheus works by scraping data from a variety of configurable sources called exporters. Node-Exporter is an exporter which collects resource utilization data from the Nodes in your Kubernetes cluster. The kube-prometheus-stack chart automatically deploys this exporter and configures your Prometheus instance to scrape it.
- Kube-State-Metrics – Kube-State-Metrics is another exporter that supplies data to Prometheus. It exposes information about the API objects in your Kubernetes cluster, such as Pods and containers.
- Grafana – Although you can directly query Prometheus, this is often tedious and repetitive. Grafana is an observability platform that works with several data sources, including Prometheus databases. You can use it to create dashboards that surface your Prometheus data.
- Alertmanager – Alertmanager is a standalone Prometheus component that provides notifications when metrics change. You can use it to get an email when CPU utilization spikes or a Slack notification if a Pod is evicted, for example.
Deploying, configuring, and maintaining all these components individually can be burdensome for administrators. Kube-Prometheus-Stack provides an automated solution that performs all the hard work for you.
System performance monitoring
Kube-Prometheus-Stack provides out-of-the-box monitoring capabilities using Prometheus, Grafana, and Alertmanager. It collects metrics from various Kubernetes components and allows you to visualize them using chart Grafana dashboards.
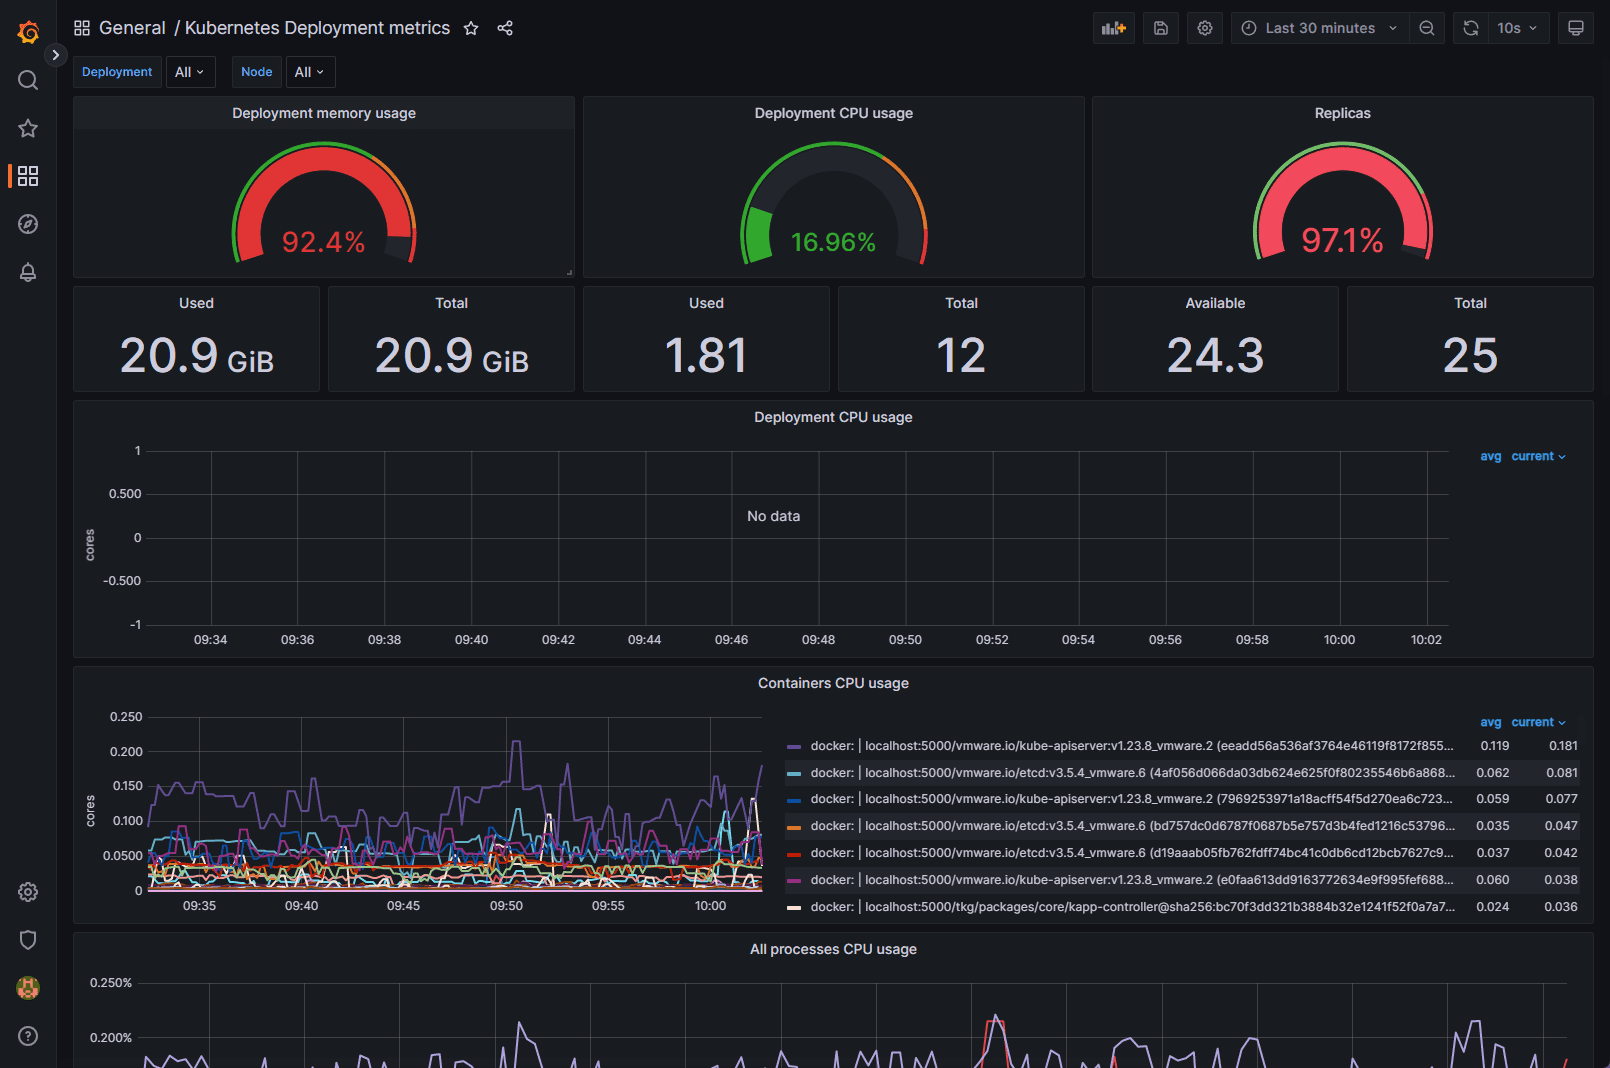
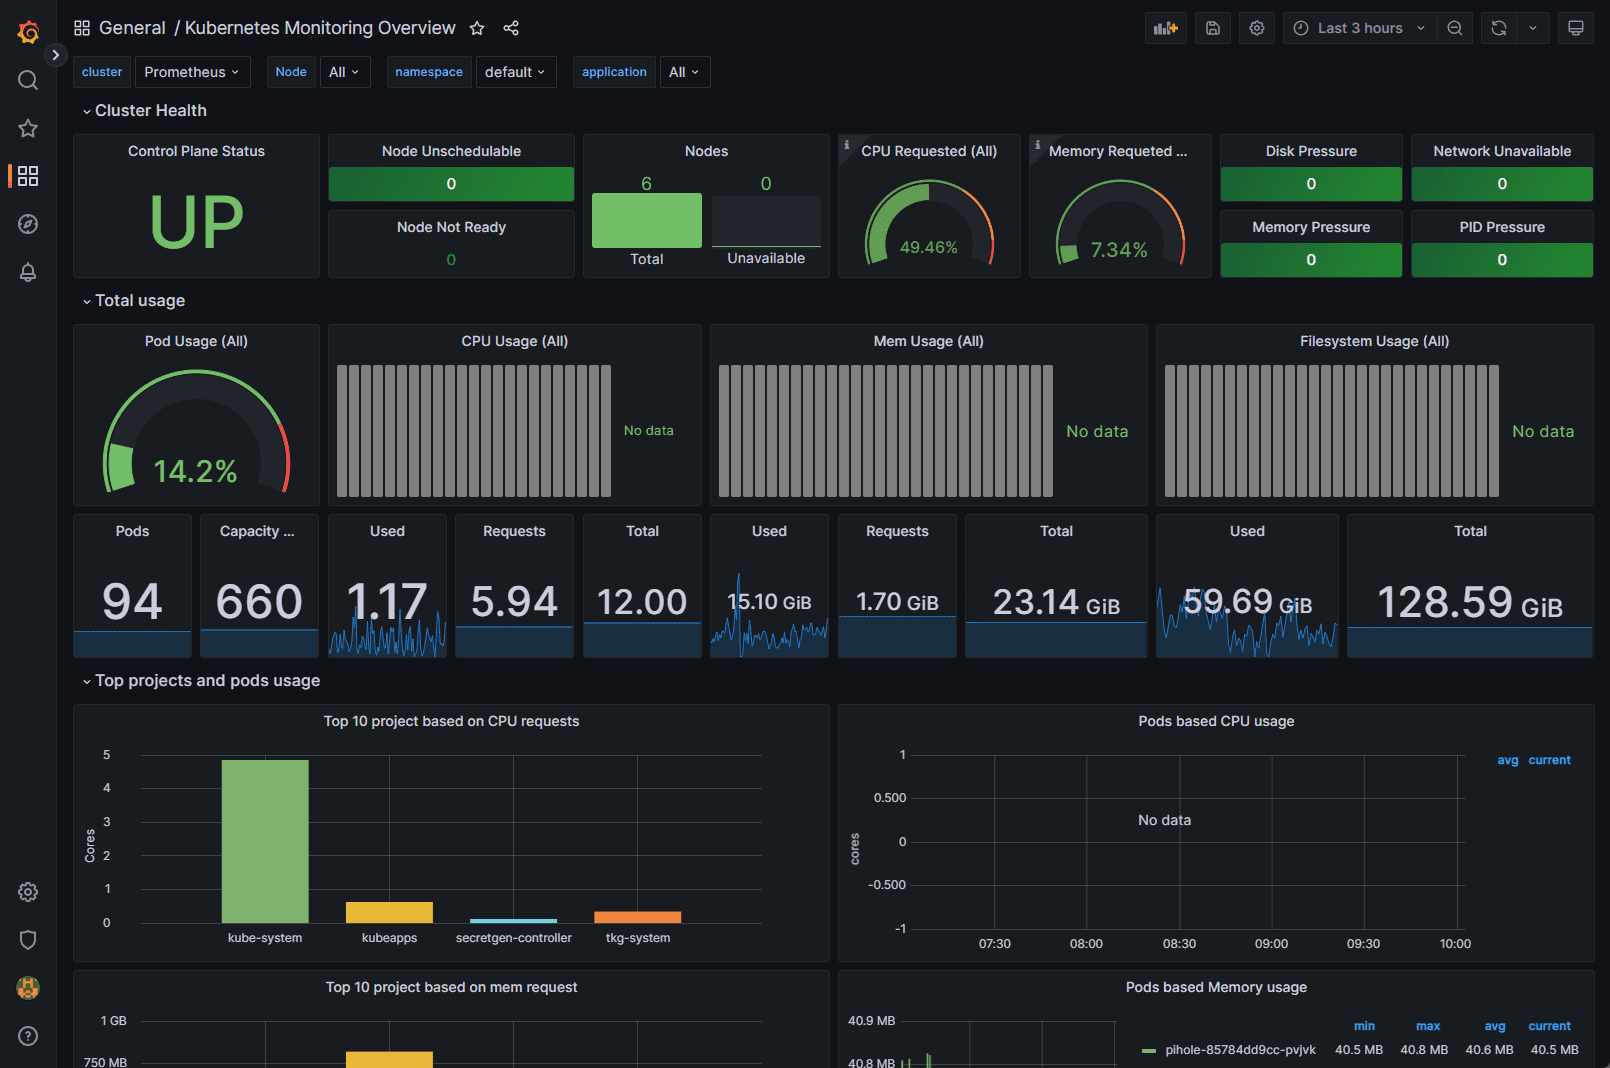
Below is another Grafana dashboard displaying Kubernetes metrics.
 After deploying the Kube-Prometheus-Stack, you can access the Grafana UI to explore and analyze your cluster’s performance metrics. You can also set up custom dashboards tailored to your specific needs.
Pre-setting
Ensure each container has a configured CPU limit
It is crucial to set CPU limits for each container to prevent resource contention and ensure optimal cluster performance. You can configure CPU limits in the resources section of the container specification in your Kubernetes deployment:
resources: limits: cpu: <CPU_LIMIT>Replace <CPU_LIMIT> with the desired value, such as 500m for 0.5 CPU cores.
Ensure each container has a configured memory request
Configuring memory requests helps Kubernetes efficiently schedule and allocate resources for your workloads. Set memory requests in the resources section of the container specification:
resources: requests: memory: <MEMORY_REQUEST>Replace <MEMORY_REQUEST> with the desired value, such as 256Mi for 256 MB of memory.
Prevent ConfigMap security vulnerability (CVE-2021-25742)
To mitigate the security vulnerability CVE-2021-25742, which affects ConfigMap usage in Kubernetes, follow these best practices:
Limit the scope of RBAC permissions: Restrict access to ConfigMaps and avoid granting users or service accounts unnecessary privileges.
Use network policies: Implement network policies to isolate and secure communication between pods.
Monitor and audit: Monitor your cluster for suspicious activity and perform regular audits to ensure compliance with security policies.
Ensure each container has a configured readiness probe
Readiness probes help Kubernetes determine when a container is ready to start accepting traffic. Configure a readiness probe in the container specification:
readinessProbe: httpGet: path: /ready port: <PORT> initialDelaySeconds: 5 periodSeconds: 10Replace <PORT> with the appropriate port number for your application.
Get Helm Repository Info
Before installing the Kube-Prometheus-Stack, you need to add the Prometheus community Helm repository to your Helm client:
(base) [yanboyang713@archlinux ~]$ helm repo add prometheus-community https://prometheus-community.github.io/helm-charts
"prometheus-community" has been added to your repositories
Next, update your repository lists to discover the chart:
(base) [yanboyang713@archlinux ~]$ helm repo update
Hang tight while we grab the latest from your chart repositories...
...Successfully got an update from the "bitnami" chart repository
...Successfully got an update from the "prometheus-community" chart repository
Update Complete. ⎈Happy Helming!⎈
This command adds the Prometheus community Helm charts repository and updates your Helm client with the latest charts and versions. To see your helm repos, you can use the helm repo list command:
(base) [yanboyang713@archlinux ~]$ helm repo list
NAME                    URL
bitnami                 https://charts.bitnami.com/bitnami
prometheus-community    https://prometheus-community.github.io/helm-charts
Installing
Now you can run the following command to deploy the chart into a new namespace in your cluster:
(base) [yanboyang713@archlinux ~]$ helm install kube-prometheus-stack \
  --create-namespace \
  --namespace monitoring \
  prometheus-community/kube-prometheus-stack
NAME: kube-prometheus-stack
LAST DEPLOYED: Wed Jun  7 22:27:41 2023
NAMESPACE: monitoring
STATUS: deployed
REVISION: 1
NOTES:
kube-prometheus-stack has been installed. Check its status by running:
  kubectl --namespace monitoring get pods -l "release=kube-prometheus-stack"

Visit https://github.com/prometheus-operator/kube-prometheus for instructions on how to create & configure Alertmanager and Prometheus instances using the Operator.
NOTE: Helm custom deployment values and agrs, please check.
It can take a couple of minutes for the chart’s components to start. Run the following command to check how they’re progressing:
(base) [yanboyang713@archlinux ~]$ kubectl -n monitoring get pods
NAME                                                        READY   STATUS    RESTARTS   AGE
alertmanager-kube-prometheus-stack-alertmanager-0           2/2     Running   0          3m47s
kube-prometheus-stack-grafana-6989bc568-v2tzj               3/3     Running   0          3m48s
kube-prometheus-stack-kube-state-metrics-677b85d988-9vmdv   1/1     Running   0          3m48s
kube-prometheus-stack-operator-5fdc5df69b-swdrm             1/1     Running   0          3m48s
kube-prometheus-stack-prometheus-node-exporter-g4h5s        1/1     Running   0          3m48s
kube-prometheus-stack-prometheus-node-exporter-lsq4p        1/1     Running   0          3m48s
kube-prometheus-stack-prometheus-node-exporter-nqrsb        1/1     Running   0          3m48s
prometheus-kube-prometheus-stack-prometheus-0               2/2     Running   0          3m46s
Once all the Pods show as Running, your monitoring stack is ready to use. The data exposed by the exporters will be automatically scraped by Prometheus.
Now you can start querying your metrics.
Running a Prometheus Query
Prometheus includes a web UI that you can use to query your data. This is not exposed automatically. You can access it by using Kubectl port forwarding to redirect local traffic to the service in your cluster:
(base) [yanboyang713@archlinux ~]$ kubectl port-forward -n monitoring svc/kube-prometheus-stack-prometheus 9090:9090
Forwarding from 127.0.0.1:9090 -> 9090
Forwarding from [::1]:9090 -> 9090
This command redirects traffic to localhost:9090 to the Prometheus service. Visiting this URL in your web browser will reveal the Prometheus UI:
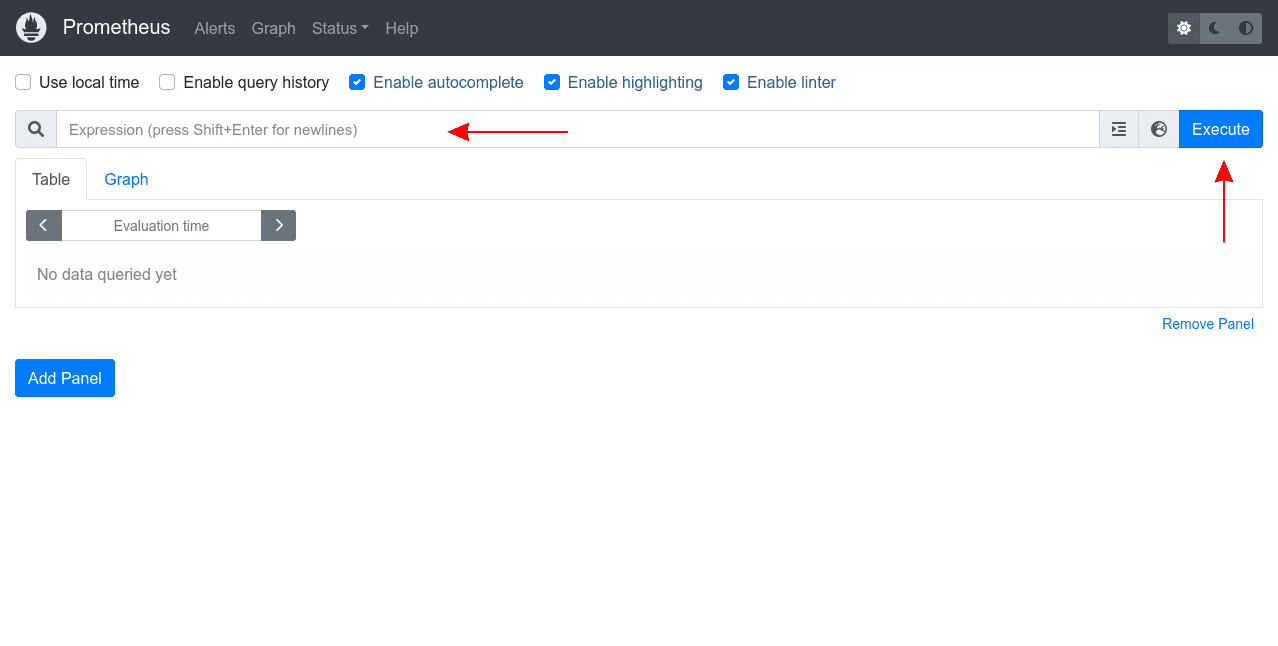
The “Expression” input at the top of the screen is where you enter your queries as PromQL expressions. Start typing into the input to reveal autocomplete suggestions for the available metrics.
Try selecting the node_memory_Active_bytes metric, which surfaces the memory consumption of each of the Nodes in your cluster. Press the “Execute” button to run your query. The results will be displayed in a table that provides the query’s raw output:
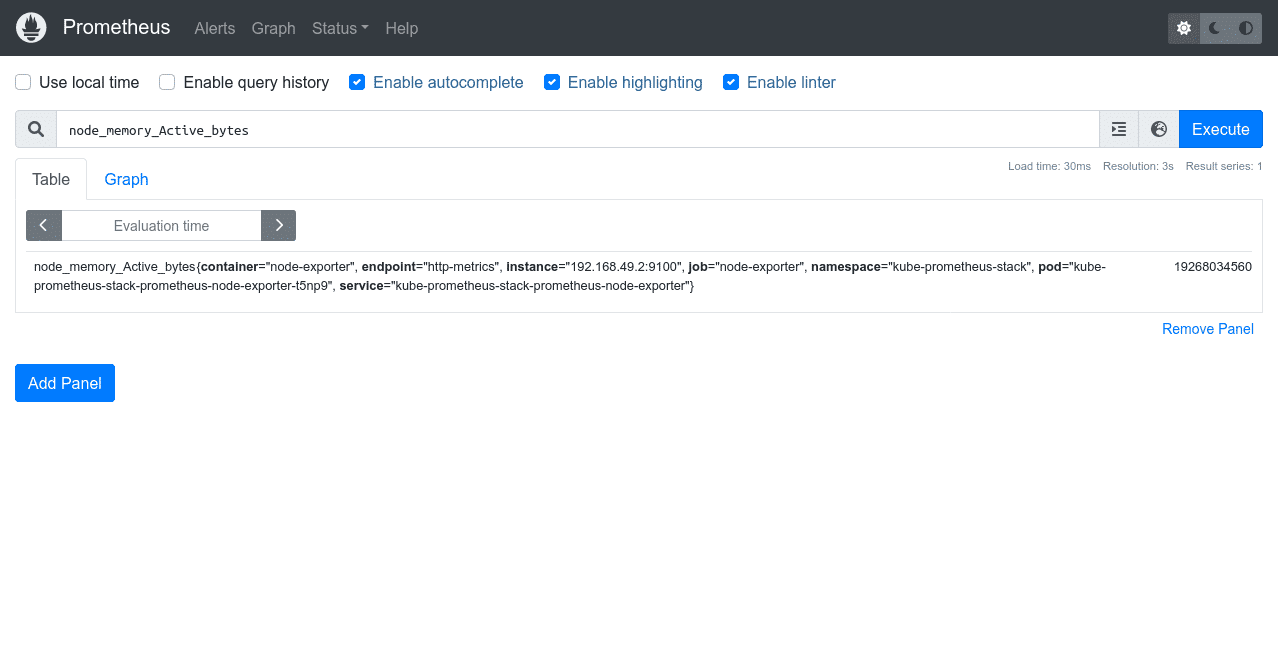
Most metrics are easier to interpret as graphs.
Switch to the “Graph” tab at the top of the screen to see a visualization of the metric over time. You can use the controls above the graph to change the time period that’s displayed.

PromQL queries allow detailed interrogation of your data. Manually running individual queries in the Prometheus UI is an inefficient form of monitoring, however.
Next, let’s use Grafana to visualize metrics conveniently on live dashboards.
Using Grafana Dashboards
Start a new Kubectl port forwarding session to access the Grafana UI. Use port 80 as the target because this is what the Grafana service binds to.
You can map it to a different local port, such as 8080, in this example:
(base) [yanboyang713@archlinux ~]$ kubectl port-forward -n monitoring svc/kube-prometheus-stack-grafana 8080:80
Forwarding from 127.0.0.1:8080 -> 3000
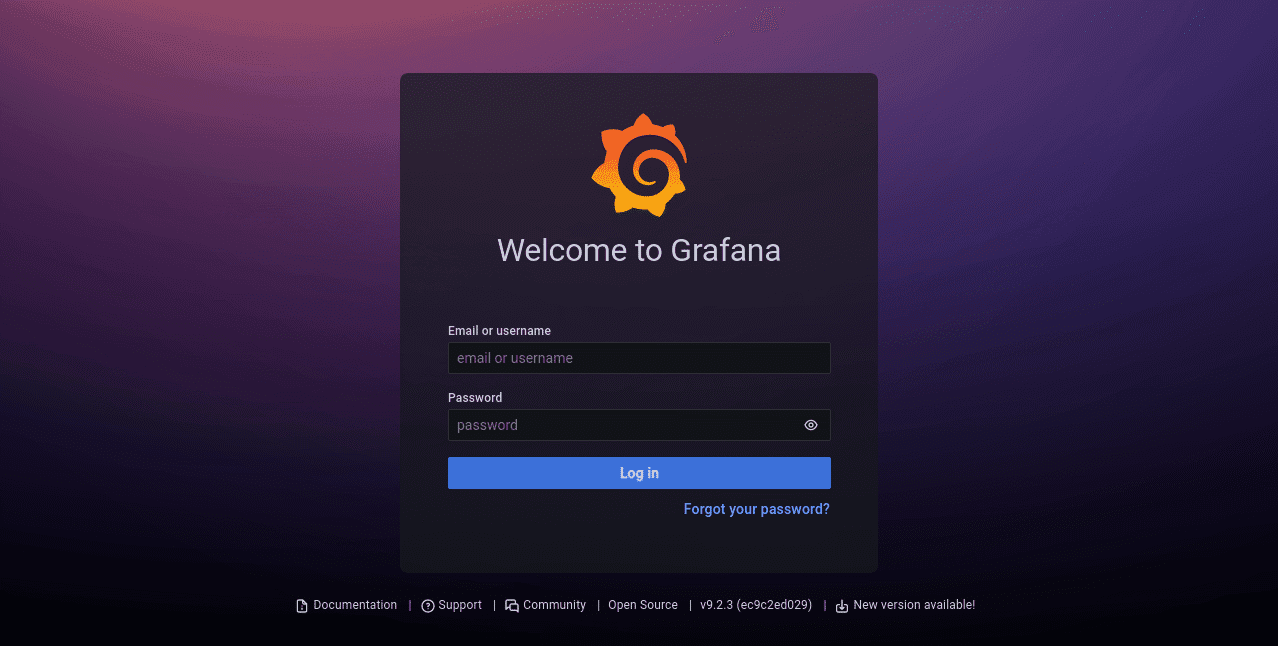
Forwarding from [::1]:8080 -> 3000Next visit http://localhost:8080 in your browser. You’ll see the Grafana login page. The default user account is admin with a password of prom-operator.
After you’ve logged in, you’ll initially reach the Grafana welcome screen:
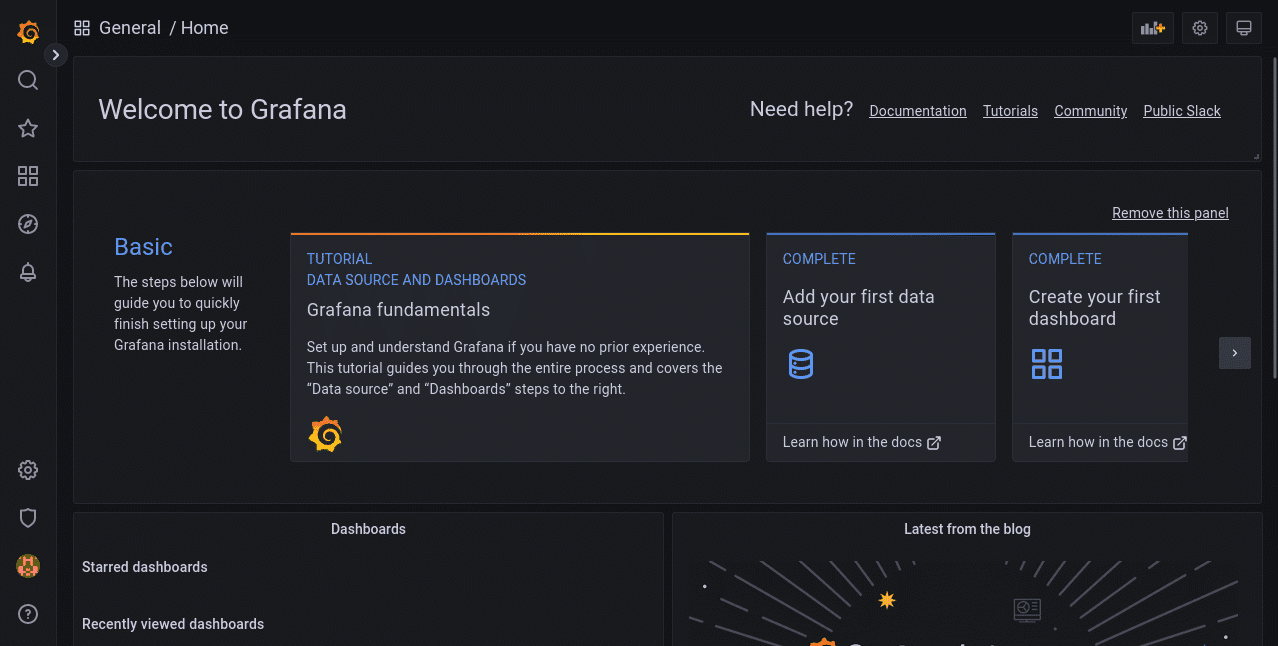
Use the sidebar to switch to the Dashboards screen. Its icon is four squares arranged to resemble panes of glass. This is where all your saved dashboards can be found, including the prebuilt ones that come with Kube-Prometheus-Stack deployments.
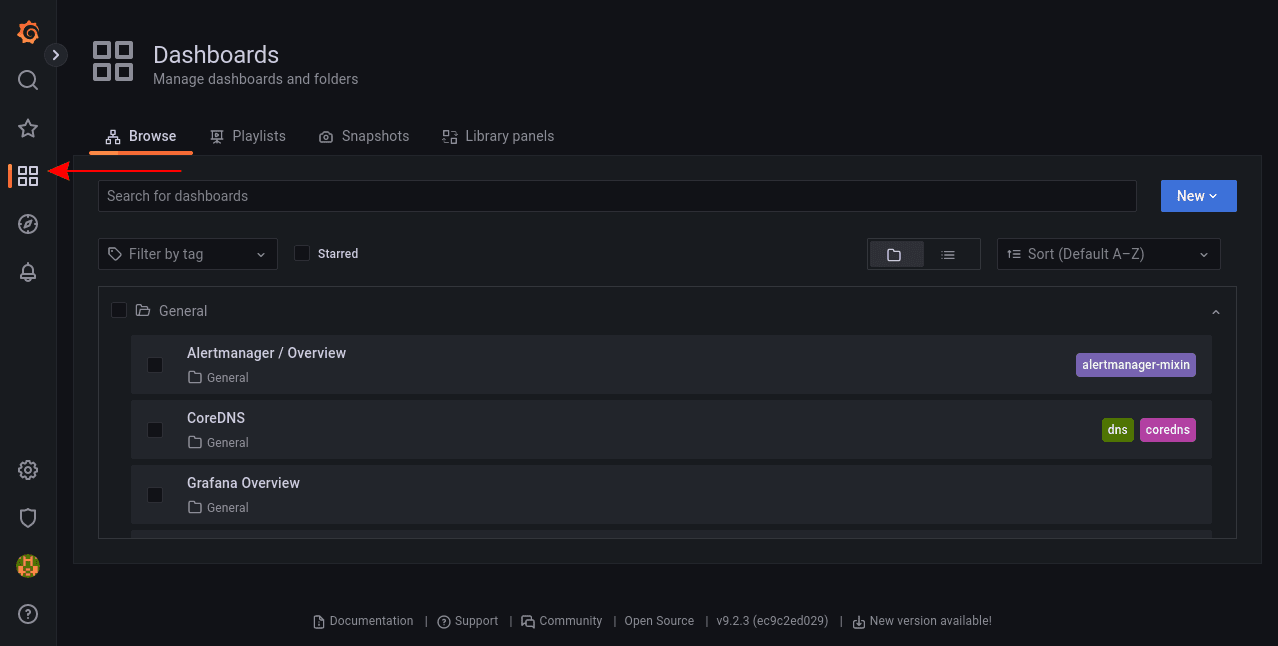
Exploring the Grafana Prebuilt Dashboards
There are several included dashboards that contain the metrics scraped from Node-Exporter, Kube-State-Metrics, and various Kubernetes and Prometheus components. Here are a few notable ones:
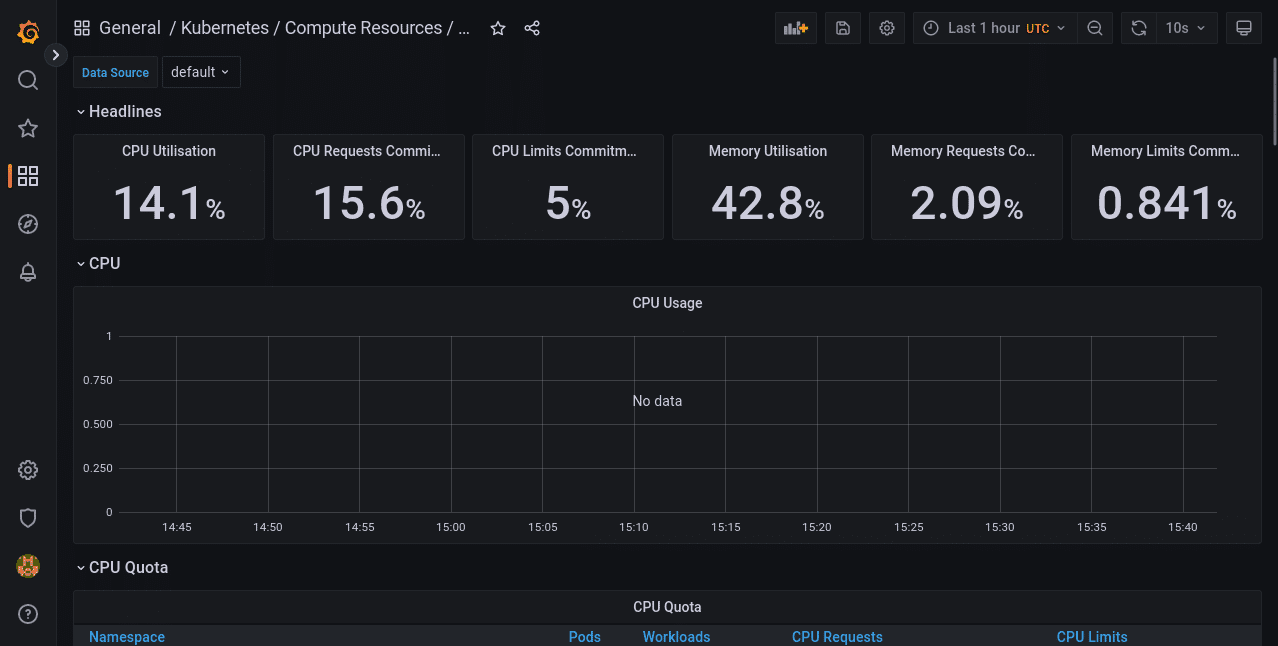
Monitoring Cluster Utilization With “Kubernetes / Compute Resources / Cluster”
This dashboard provides an overview of the resource utilization for your entire cluster. Headline statistics are displayed at the top, with more detailed information presented in panels below.
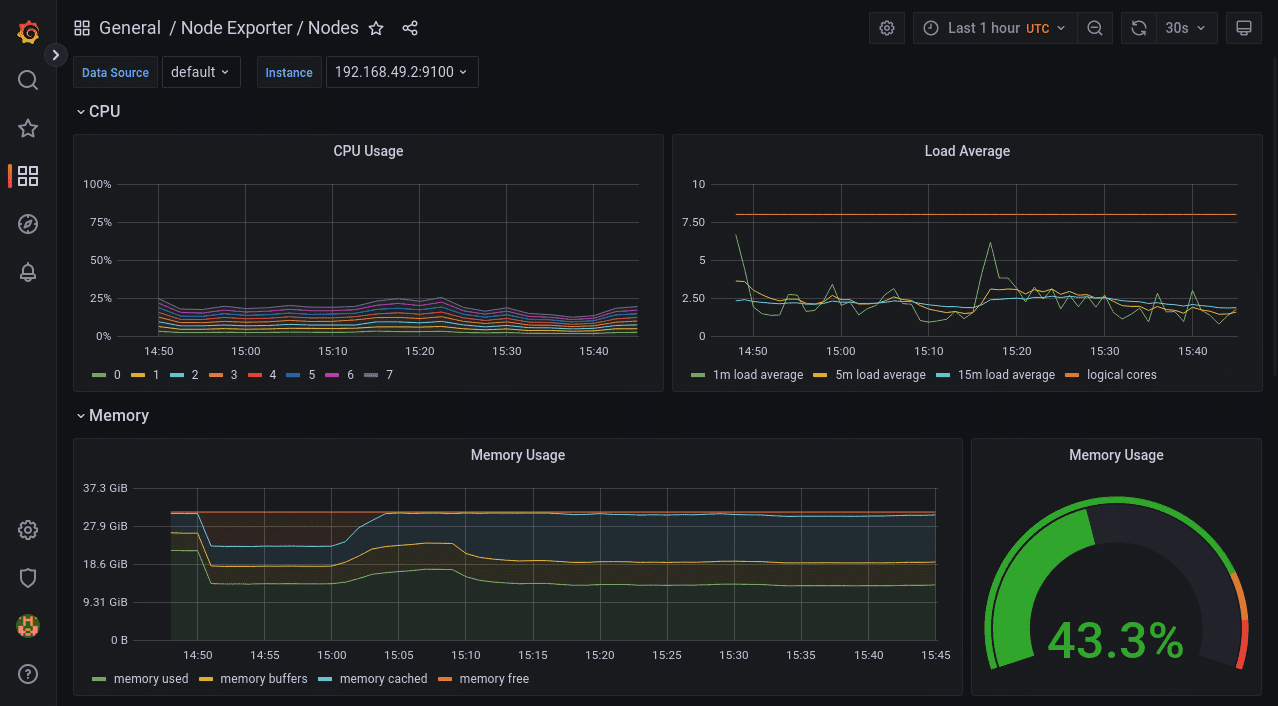
Viewing a Node’s Resource Consumption With “Node Exporter / Nodes”
Data collected by Node-Exporter is provided by this dashboard. It shows detailed resource utilization information on a per-Node basis. You can change the selected Node using the “instance” dropdown at the top of the dashboard.
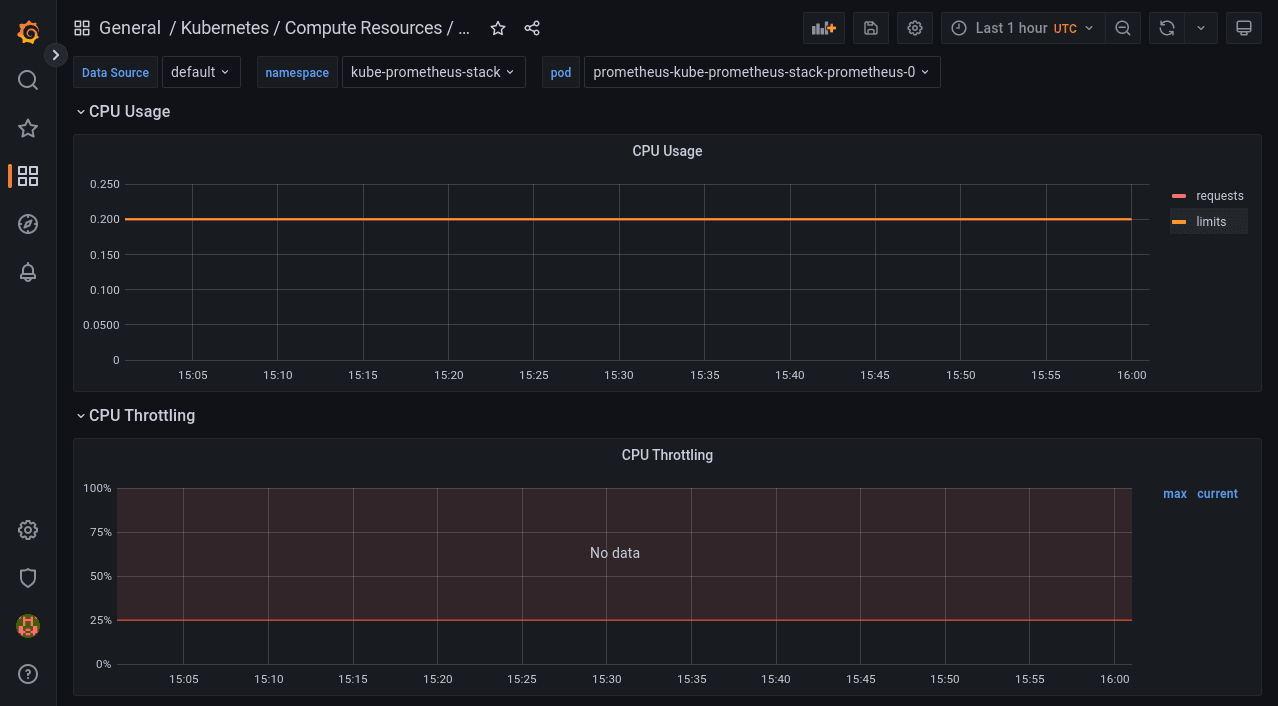
Viewing the Resource Consumption of Individual Pods With “Kubernetes / Compute Resources / Pod”
This dashboard shows the resource requests, limits, quotas, and utilization for individual Pods. You can select the namespace and Pod to view from the dropdowns at the top of the screen.
The time frame can be customized on all Grafana dashboards using the controls in the top-right corner of the screen. You can refresh the data or change the auto-refresh interval with the button next to the time frame selector.
Configuring Alerts With Alertmanager
Monitoring must be automated to be effective. You need to receive alerts when important metric stops meeting expectations, such as when a spike in memory consumption occurs. Otherwise, you have to continually check your dashboards or run queries to determine whether you need to take action.
Prometheus includes Alertmanager to send you a notification when your metrics trigger an alert. Alertmanager supports multiple receivers that act as destinations for your alerts, such as email, Slack, messaging apps, and your own webhooks.
Kube-Prometheus-Stack’s bundled Alertmanager is configured by merging in custom chart values when you deploy the stack with Helm. First, prepare a YAML file that nests your Alertmanager settings under the top-level alertmanager key. Here’s an example that sends all alerts to a webhook URL:
lertmanager:
  config:
    global:
      resolve_timeout: 5m
    route:
      receiver: demo-webhook
      group_wait: 5s
      group_interval: 10s
      repeat_interval: 1h
    receivers:
      - name: "null"
      - name: demo-webhook
        webhook_configs:
          - url: http://example.com/webhook
            send_resolved: true
The route section specifies that alerts should be directed to the demo-webhook receiver. This is configured to send a POST request to http://example.com/webhook each time an alert is triggered or resolved. The request’s payload is described in the Alertmanager documentation. Note that the extra “null” receiver is required due to a bug that otherwise prevents your route from working.
Save your YAML file to alertmanager-config.yaml in your working directory. Next run the following command to redeploy the Prometheus stack and apply your Alertmanager settings:
helm upgrade --reuse-values \
  -f alertmanager-config.yaml \
  -n monitoring \
  kube-prometheus-stack
  prometheus-community/kube-prometheus-stack
Don’t worry – you won’t lose any of your existing data. The command performs an in-place upgrade of your deployment.
It could take a few minutes for Alertmanager to reload its configuration after the deployment completes. You’ll then begin to receive requests to your webhook URL, as alerts are triggered.
To send a test alert, first start a port forwarding session to your Alertmanager instance:
kubectl port-forward -n monitoring svc/kube-prometheus-stack-alertmanager 9093:9093Next run the following command to simulate triggering a basic alert from a Kubernetes service in a specific namespace:
curl -H 'Content-Type: application/json' -d '[{"labels":{"alertname":"alert-demo","namespace":"demo","service":"demo"}}]' http://127.0.0.1:9093/api/v1/alertsAfter a few moments, you should receive a request to your webhook URL. The request’s body will describe the alert’s details.
You can also run multiple Prometheus instances and manage these from a single Prometheus operator. Just install multiple Prometheus objects to your cluster with different configurations. The Prometheus operator will manage any number of Prometheus instances.
You can watch the Prometheus operator install using the following command:
kubectl get deploy -w --namespace kubeapps -l app.kubernetes.io/name=kube-prometheus-operator,app.kubernetes.io/instance=prometheusUpgrading Chart
Review the release notes for any breaking changes or required manual actions when upgrading to a new major version of the Kube-Prometheus-Stack Helm chart. To upgrade the Kube-Prometheus-Stack Helm chart to the latest version, use the following command:
helm upgrade <RELEASE_NAME> prometheus-community/kube-prometheus-stack -n <NAMESPACE>Replace <RELEASE_NAME> with the name of your release and <NAMESPACE> with the namespace in which the release is deployed.
Uninstall Helm Chart
To uninstall the Kube-Prometheus-Stack Helm chart, use the following command:
helm uninstall <RELEASE_NAME> -n <NAMESPACE>Replace <RELEASE_NAME> with the name of your release and <NAMESPACE> with the namespace in which the release is deployed.
Tracking installations
You can track major chart version change using the:
helm history command and keeping up with the versions installed and updated.
helm history kubeapps -n kubeappsAdditional kube-prometheus recommendations
To enhance the effectiveness of your Kube-Prometheus-Stack deployment, consider these additional recommendations:
- Use dedicated namespaces for monitoring components to segregate them from other workloads.
- Implement role-based access control (RBAC) to secure access to your monitoring components.
- Monitor and analyze the logs from your Prometheus, Grafana, and Alertmanager instances for insights into their performance and potential issues.
Prevent workload from using the default namespace
Using the default namespace for workloads is discouraged due to potential conflicts and security concerns. Instead, create dedicated namespaces for each workload, following a logical and consistent naming convention.
Kubernetes Exporters
Kube-Prometheus-Stack includes several exporters that collect metrics from various Kubernetes components:
- Node exporter: Collects hardware and OS metrics from each node in the cluster.
- Kube-state-metrics: Exposes cluster-wide Kubernetes object state metrics, such as deployments, pods, and services.
- Kubelet: Provides container and pod-level metrics, such as resource usage and container restarts.
Use federation for multiple clusters
Prometheus federation enables you to aggregate metrics from multiple clusters into a central Prometheus instance. This approach simplifies the monitoring and analysis of large-scale, multi-cluster environments. To configure federation, set up a central Prometheus server to scrape the /federate endpoint of each target Prometheus instance in your clusters.
Developing Prometheus Rules and Grafana Dashboards
Customize your monitoring setup by developing tailored Prometheus rules and Grafana dashboards:
- Prometheus rules: Define custom alerting and recording rules based on your specific needs and use cases. Prometheus rules are written in the Prometheus Query Language (PromQL).
- Grafana dashboards: Design custom dashboards in Grafana to visualize the metrics collected by Prometheus. Use Grafana’s flexible panels, graphs, and alerts to create an informative and actionable view of your cluster’s performance.
PrometheusRules Admission Webhooks
PrometheusRules admission webhooks are a validation mechanism to ensure that the Prometheus rules you create are syntactically correct and compliant with your organization’s policies. Implementing admission webhooks can help prevent misconfigurations that could lead to incorrect alerts or metrics collection.
Account for persistent storage requirements
To store historical data and ensure the durability of your monitoring data, configure persistent storage for Prometheus and Grafana. Use Kubernetes Persistent Volumes (PVs) and Persistent Volume Claims (PVCs) to attach dedicated storage to your monitoring components.
Multiple releases
In some cases, you might want to deploy multiple instances of the Kube-Prometheus-Stack, such as in multi-tenant environments or for testing purposes. To deploy multiple releases, use unique release names and namespaces for each instance.
Running on private GKE clusters
When deploying Kube-Prometheus-Stack on private GKE clusters, ensure that your GKE nodes, including GKE control plane nodes, have access to the required container image repositories and Helm chart repositories. Configure your firewall rules to allow ingress traffic to your monitoring components, such as Prometheus, Grafana, and Alertmanager.
How the Chart Configures the Hooks
Helm hooks automate tasks during a Helm release’s deployment, upgrade, or rollback. The Kube-Prometheus-Stack chart utilizes hooks to perform tasks such as:
- Initializing or upgrading the CRDs (Custom Resource Definitions) required for Prometheus, Alertmanager, and other monitoring components.
- Running pre- and post-installation jobs, such as creating or updating Kubernetes resources, configuring security settings, or cleaning up resources after uninstallation.
Zero downtime
Achieving zero downtime when upgrading or redeploying the Kube-Prometheus-Stack can be challenging due to the nature of monitoring components. However, you can minimize the impact by:
- Deploying a highly available Prometheus setup with replication and sharding ensures redundancy and load balancing.
- Using rolling updates for your deployments to reduce the impact on your monitoring infrastructure during upgrades.
Redeploy with a new name (downtime)
In cases where downtime is acceptable or unavoidable, you can redeploy the Kube-Prometheus-Stack with a new name by following these steps:
- Uninstall the current release using the helm uninstall command.
- Install the Kube-Prometheus-Stack with a new release name using the helm install command.
Be aware that this approach results in a temporary loss of monitoring capabilities during the redeployment process.