To figure out the difference between a cluster and a gold-standard cluster.
A confusion matrix is typically used for supervised learning tasks, especially classification, to visualize the performance of an algorithm. It shows the actual versus predicted classifications. For clustering, which is an unsupervised learning task, the concept of a confusion matrix doesn’t directly apply because there isn’t a “true” label against which to compare cluster assignments.
However, in some cases, you might have ground truth labels for your data and wish to see how well your clustering algorithm grouped similar items. In this case, you could use something similar to a confusion matrix to understand the correspondence between true labels and cluster assignments.
To do this, you would:
- Assign each cluster to a ground truth label based on the majority label in the cluster.
- Count the number of data points for each combination of true label and assigned cluster.
The resulting matrix would show you how many data points of each true label ended up in each cluster.
Here’s an example:
Imagine you have a dataset with three true labels: A, B, and C. After clustering, you have three clusters: X, Y, and Z.
Your “confusion matrix” might look like this:
```
| X | Y | Z |
A | 50 | 5 | 3 | B | 2 | 48 | 2 | C | 1 | 4 | 52 | ```
This table shows that 50 data points with true label A were assigned to cluster X, 5 to cluster Y, and 3 to cluster Z, and so on for labels B and C.
Keep in mind, though, that clustering isn’t about finding a 1:1 mapping between clusters and true labels. A good clustering might still distribute a single true label across multiple clusters if there are sub-groups within that label. So, while this kind of table can be helpful, it’s not a definitive measure of clustering quality.
For evaluating clustering performance, other metrics like Silhouette Score, Davies-Bouldin Index, and Adjusted Rand Index might be more appropriate. If you have ground truth labels, the Adjusted Rand Index (ARI) in particular can provide a measure of similarity between the true labels and the cluster assignments.
 Given an actual label and a predicted label, the first thing we can do is divide our samples in 4 buckets:
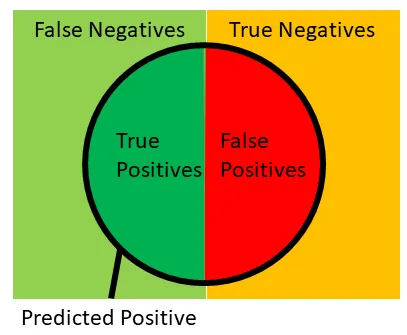
- True positive — actual = 1, predicted = 1
- False positive — actual = 0, predicted = 1
- False negative — actual = 1, predicted = 0
- True negative — actual = 0, predicted = 0
These buckets can be represented with the following image (original source) and we will reference this image in many of the calculations below.
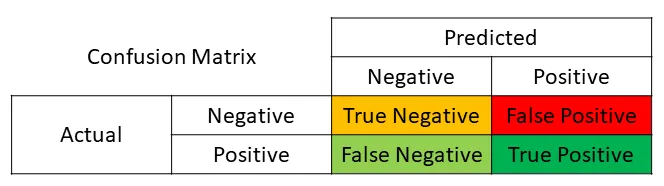
 These buckets can also be displayed using a confusion matrix as shown below:
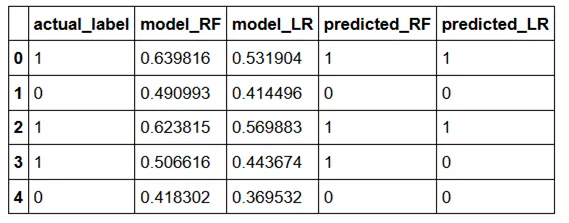
 We can obtain the confusion matrix (as a 2x2 array) from scikit-learn, which takes as inputs the actual labels and the predicted labels
from sklearn.metrics import confusion_matrix
confusion_matrix(df.actual_label.values, df.predicted_RF.values)
where there were 5047 true positives, 2360 false positives, 2832 false negatives and 5519 true negatives. Let’s define our own functions to verify confusion_matrix. Note that I filled in the first one and you need to fill in the other 3.
def find_TP(y_true, y_pred):
    # counts the number of true positives (y_true = 1, y_pred = 1)
    return sum((y_true == 1) & (y_pred == 1))
def find_FN(y_true, y_pred):
    # counts the number of false negatives (y_true = 1, y_pred = 0)
    return # your code here
def find_FP(y_true, y_pred):
    # counts the number of false positives (y_true = 0, y_pred = 1)
    return # your code here
def find_TN(y_true, y_pred):
    # counts the number of true negatives (y_true = 0, y_pred = 0)
    return # your code here
You can check your results match with
print('TP:',find_TP(df.actual_label.values, df.predicted_RF.values))
print('FN:',find_FN(df.actual_label.values, df.predicted_RF.values))
print('FP:',find_FP(df.actual_label.values, df.predicted_RF.values))
print('TN:',find_TN(df.actual_label.values, df.predicted_RF.values))
Let’s write a function that will calculate all four of these for us, and another function to duplicate confusion_matrix
import numpy as np
def find_conf_matrix_values(y_true,y_pred):
    # calculate TP, FN, FP, TN
    TP = find_TP(y_true,y_pred)
    FN = find_FN(y_true,y_pred)
    FP = find_FP(y_true,y_pred)
    TN = find_TN(y_true,y_pred)
    return TP,FN,FP,TN
def my_confusion_matrix(y_true, y_pred):
    TP,FN,FP,TN = find_conf_matrix_values(y_true,y_pred)
    return np.array([[TN,FP],[FN,TP]])
Check your results match with
my_confusion_matrix(df.actual_label.values, df.predicted_RF.values)Instead of manually comparing, let’s verify that our functions worked using Python’s built in assert and numpy’s array_equal functions
assert  np.array_equal(my_confusion_matrix(df.actual_label.values, df.predicted_RF.values), confusion_matrix(df.actual_label.values, df.predicted_RF.values) ), 'my_confusion_matrix() is not correct for RF'
assert  np.array_equal(my_confusion_matrix(df.actual_label.values, df.predicted_LR.values),confusion_matrix(df.actual_label.values, df.predicted_LR.values) ), 'my_confusion_matrix() is not correct for LR'
Given these four buckets (TP, FP, FN, TN), we can calculate many other performance metrics.